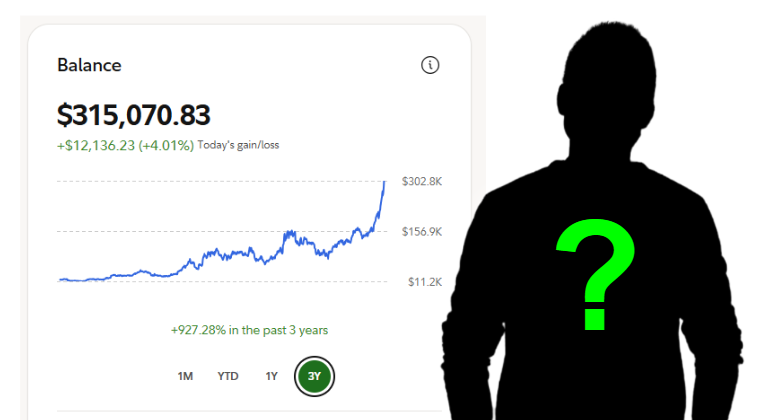
>>>Don’t miss Sunday’s Viral Stock Summit — where my star student will reveal the trading engine that turned $38k into $312k by spotting social-momentum stocks on X before anyone else. Save your seat now and see how this Viral Stock Scanner could change your next trade!<<<
There’s a rhythm to the market that most traders either don’t know about or choose to ignore. It’s not some secret signal or complicated indicator — it’s the presidential election cycle.
And right now, we’re sitting in one of the most bullish windows of that four-year pattern.
I’ve been diving deep into the data, and here’s what I’m: The next 45 or so days should be very, very bullish. In fact, I think we’re probably looking at strength until about March.
That’s not a guess — that’s what the historical patterns are telling us. But here’s where it gets interesting…
After March, we move into the midterm year, and that’s when things tend to get choppy. The rally doesn’t just keep going forever. The data shows strength through March, then a potential cool-off during summer — the classic “sell in May and go away” scenario.
Understanding the Presidential Cycle Pattern
The post-election year we’re experiencing tends to be very bullish, and we’ve certainly seen that play out. But the second year of the term — the midterm year — is pretty flat overall.
When I look at the visual charts comparing these patterns, it’s striking. The year we just had showed a dip in February through April, then rallied all year long. The midterm year typically shows strength until March, then that summer cool-off kicks in.
This isn’t guesswork — this pattern is based on 75 years of data. The presidential cycle creates predictable seasonal windows, just like general seasonality. You can trade around it if you understand when to press and when to protect.
Now, there’s a silver lining here. The pre-election year — which is about a year out from today — is the most exciting time to be trading stocks in the presidential cycle. But we’ve got to navigate the midterm chop first.
A Rare Historical Setup Worth Noting
Here’s something interesting I came across…
The S&P 500 (SPY) was down more than 15% year-to-date in April but will likely close up double digits — meaning 10% or more for the year.
That’s only happened four times in the past 75 years. And each time that’s happened, the next year typically saw double-digit gains again.
Now, I’ll be transparent with you — this is only three previous data points, so it’s not necessarily statistically significant. But it is interesting to note when you’re thinking about 2026’s potential trajectory.
The point isn’t to make predictions based on limited data. The point is to understand context. We’re in a historically bullish window right now, and we should have a really good run into the new year. But after March? That’s when we need to stay sharp and adjust our approach.
The market doesn’t care about what we want it to do. But if you understand these cycles, you can position yourself accordingly — pressing when the odds are in your favor and dialing back when the data suggests caution.
Graham Lindman
Graham Lindman Trading
Follow along and join the conversation for real-time analysis, trade ideas, market insights and more!
- Telegram:https://t.me/+abM5RWRJKrpkNWI5
- YouTube:https://www.youtube.com/@NewMoneyCrew
Important Note: No one from the ProsperityPub team or Graham Lindman Trading will ever contact you directly on Telegram.
*This is for informational and educational purposes only. There is inherent risk in trading, so trade at your own risk.
P.S. Have You Saved Your Seat for the Viral Stock Summit on Sunday?
Have you saved your seat for the Viral Stock Summit on Sunday?
If you haven’t, now’s the time to quickly go here and save yourself a seat for the big reveal!
Because in that special event, I’ll be inviting my star student, Dave, to clue us in on a truly revolutionary trading engine…
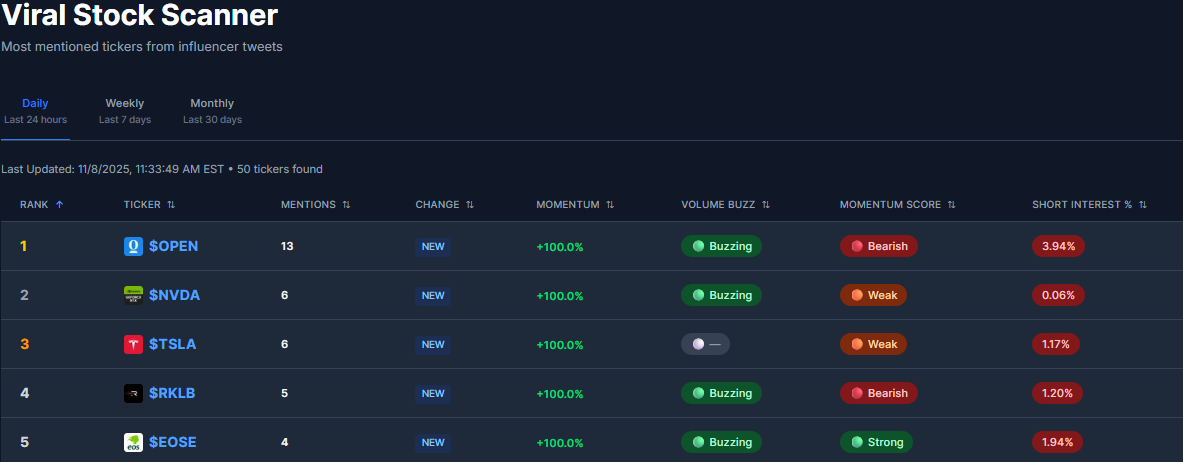
One that’s shown the power to scan Twitter (now X) – the world’s biggest source of financial chatter for retail trading – for stocks gaining social momentum.
He then turns this social momentum into cash opportunities on stocks you’d typically overlook.
Over the last three years, doing just this has helped him turn a $38k account into $312k… outperforming every hedge fund on the market within that timeframe!
Of course, I can’t make absolute guarantees here…
But if you’d like a front row seat to see the Viral Stock Scanner in action…
As well as how you can get your hands on it for your next trade…
Just save your seat here to join in LIVE at 7 p.m. ET on Sunday!
I Recommend You Not Miss Out on This One…
We develop tools and strategies to the best of our ability but no one can guarantee the future. There is always a risk of loss when trading past performance is not indicative to future results. The profits and performance shown are not typical, we make no future earnings claims and you may lose money. Since the Viral Stock Scanner is a tool for traders and not a trading service, profits and performance will vary among users.
